Now Reading: Comprehensive Guide to Root Cause Analysis Using Visual Paradigm’s Smart Board
-
01
Comprehensive Guide to Root Cause Analysis Using Visual Paradigm’s Smart Board
Comprehensive Guide to Root Cause Analysis Using Visual Paradigm’s Smart Board
Introduction to Root Cause Analysis
Root Cause Analysis (RCA) is a systematic approach to identifying the underlying causes of problems or events. It is widely used in various fields to prevent recurrence of issues by addressing their root causes rather than just the symptoms. One of the most effective tools for RCA is the Fishbone (Ishikawa) Diagram, which visually organizes potential causes of a problem into categories.
When to Use Root Cause Analysis (RCA)
Root Cause Analysis (RCA) is a systematic approach to identifying the underlying causes of problems or events. It is particularly useful in various scenarios where understanding the root causes is essential for effective problem-solving and prevention. Here are some situations where RCA is beneficial:
-
Recurring Problems:
- When a problem keeps recurring despite attempts to fix it, RCA can help identify the underlying causes that need to be addressed to prevent recurrence.
-
Complex Issues:
- For complex problems with multiple contributing factors, RCA provides a structured approach to dissect the issue and identify all potential causes.
-
High-Impact Events:
- In cases of high-impact events such as major failures, accidents, or significant deviations from expected outcomes, RCA is crucial to understand what went wrong and how to prevent similar events in the future.
-
Process Improvement:
- When aiming to improve processes, RCA can help identify inefficiencies, bottlenecks, and areas for improvement by tracing back to the root causes of current issues.
-
Quality Control:
- In quality control and assurance, RCA is used to identify the root causes of defects, non-conformities, or customer complaints to enhance product or service quality.
-
Incident Investigation:
- In industries such as healthcare, manufacturing, and aviation, RCA is essential for investigating incidents, accidents, or near-misses to ensure safety and compliance.
Pros of Root Cause Analysis
-
Comprehensive Understanding:
- RCA provides a deep understanding of the problem by identifying all contributing factors, not just the immediate symptoms.
-
Preventive Measures:
- By addressing the root causes, RCA helps in implementing effective preventive measures to avoid recurrence of the problem.
-
Structured Approach:
- RCA offers a structured and systematic approach to problem-solving, ensuring that all potential causes are considered and analyzed.
-
Improved Decision-Making:
- The insights gained from RCA enable better decision-making by providing a clear understanding of the underlying issues and their interrelationships.
-
Continuous Improvement:
- RCA supports continuous improvement efforts by identifying areas for enhancement and optimizing processes and systems.
-
Enhanced Communication:
- The visual tools used in RCA, such as Fishbone Diagrams, facilitate better communication and collaboration among team members by providing a clear and shared understanding of the problem.
Cons of Root Cause Analysis
-
Time-Consuming:
- RCA can be time-consuming, especially for complex problems with multiple contributing factors. The detailed analysis required may delay immediate corrective actions.
-
Resource-Intensive:
- Conducting a thorough RCA requires significant resources, including personnel, time, and sometimes specialized tools or expertise.
-
Complexity:
- The complexity of RCA can be overwhelming, particularly for those not familiar with the methodology. It requires a structured and disciplined approach to ensure all potential causes are identified and analyzed.
-
Potential for Overanalysis:
- There is a risk of overanalyzing the problem, leading to analysis paralysis where too much time is spent on identifying causes rather than implementing solutions.
-
Resistance to Change:
- Identifying root causes may reveal systemic issues or require significant changes, which can face resistance from stakeholders who are resistant to change.
-
Limited Scope:
- RCA may have a limited scope if not conducted thoroughly, leading to incomplete or superficial analysis that does not address all underlying causes.
Understanding the Fishbone (Ishikawa) Diagram
The Fishbone Diagram, also known as the Ishikawa Diagram, is a visual tool that helps identify and categorize the possible causes of a problem. It is called a “Fishbone” Diagram because of its resemblance to the skeleton of a fish. The diagram consists of a central spine representing the problem, with branches extending from it to represent categories of causes. Each branch can further split into smaller branches to represent specific causes within each category.
Key Categories in a Training Program Failure
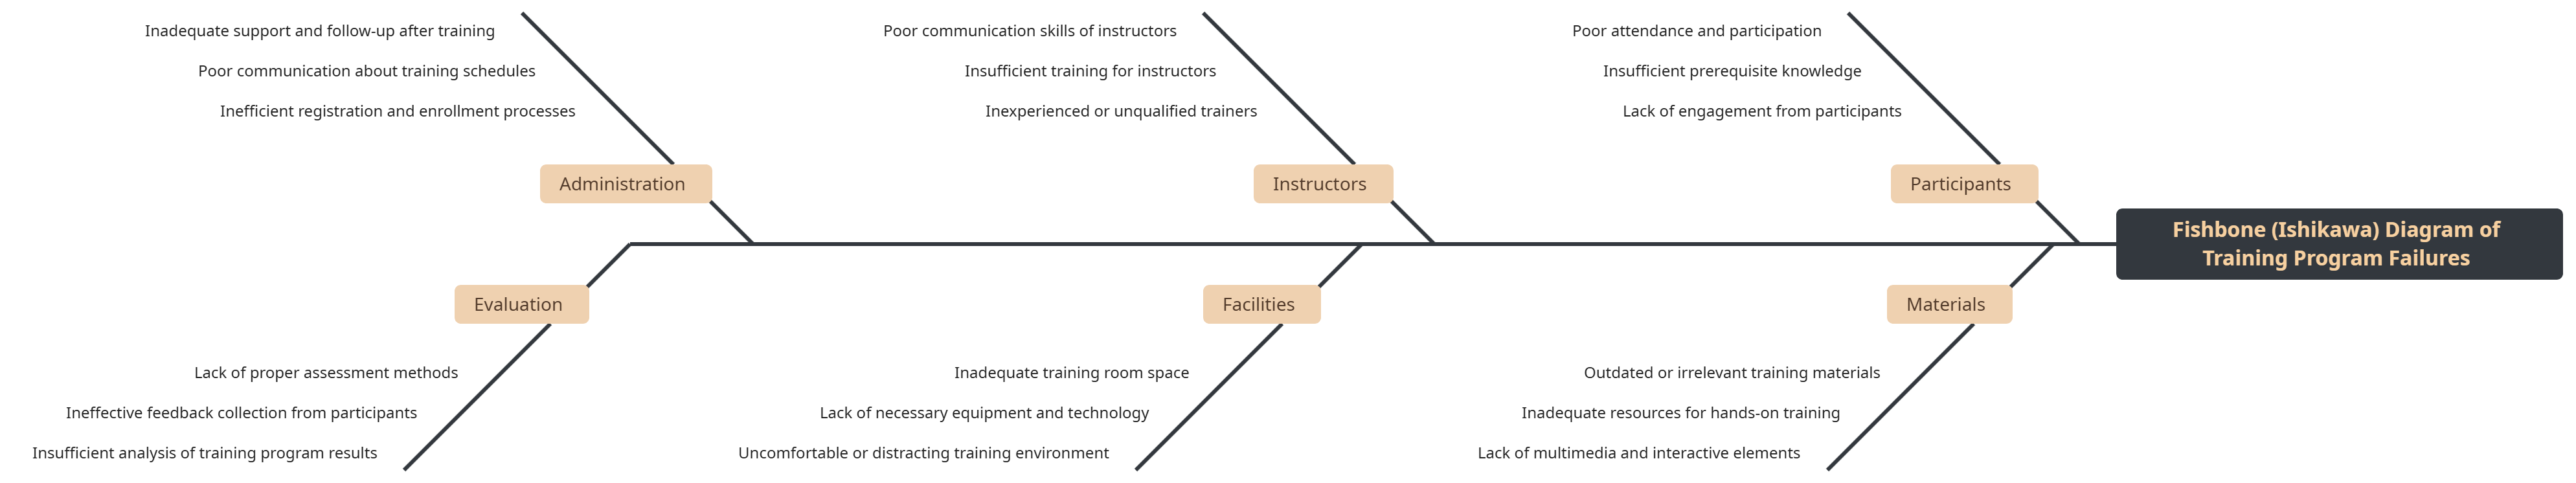
The mind map addresses the challenges and potential failures in training programs through a Fishbone Diagram. It highlights key categories contributing to training deficiencies:
-
Participants:
- Poor attendance and participation
- Insufficient prerequisite knowledge
- Lack of engagement from participants
-
Materials:
- Outdated or irrelevant training materials
- Inadequate resources for hands-on training
- Lack of multimedia and interactive elements
-
Instructors:
- Poor communication skills of instructors
- Insufficient training for instructors
- Inexperience or unqualified trainers
-
Facilities:
- Inadequate training room space
- Lack of necessary equipment and technology
- Uncomfortable or distracting training environment
-
Administration:
- Inadequate support and follow-up after training
- Poor communication about training schedules
- Inefficient registration and enrollment processes
-
Evaluation:
- Lack of proper assessment methods
- Ineffective feedback collection from participants
- Insufficient analysis of training program results
Creating a Fishbone Diagram with Visual Paradigm’s Smart Board
Visual Paradigm’s Smart Board is a powerful tool for creating Fishbone Diagrams. Here’s how you can use it to perform a root cause analysis:
-
Access the Smart Board:
- Visit the Visual Paradigm website and access the Smart Board feature. No registration or sign-up is required, making it easy to start immediately.
-
Select a Template:
- Choose from a variety of templates, including the Fishbone Diagram. This template provides a structured framework to start your analysis.
-
Identify the Problem:
- Define the problem you are analyzing and place it at the “head” of the fishbone. This is the central spine of your diagram.
-
Categorize the Causes:
- Identify the key categories that could contribute to the problem. Common categories include Participants, Materials, Instructors, Facilities, Administration, and Evaluation.
- Create branches from the central spine for each category.
-
Brainstorm Specific Causes:
- For each category, brainstorm specific causes that could contribute to the problem.
- Add these causes as smaller branches extending from the category branches.
-
Visualize and Analyze:
- Use the diagram to visualize the interconnected causes of the problem. This visual representation helps in understanding the complexity of the issue and identifying the root causes.
-
Collaborate and Refine:
- Use the collaborative features of Smart Board to involve team members in the analysis. Real-time editing and sharing capabilities allow for collective brainstorming and refinement of the diagram.
-
Implement Solutions:
- Based on the identified root causes, develop and implement solutions to address the issues. The Fishbone Diagram serves as a roadmap for strategic improvements.
Benefits of Using Visual Paradigm’s Smart Board
- User-Friendly Interface: The tool is designed to be intuitive and easy to use, allowing anyone to create and manipulate Fishbone Diagrams effortlessly.
- Comprehensive Templates: A variety of templates are available, making it quick and efficient to start your analysis.
- Collaborative Capabilities: Real-time collaboration features enable teamwork and collective problem-solving.
- Interactive and Dynamic: The diagrams created are interactive and can be embedded in various applications, enhancing usability and engagement.
- Free to Use: Visual Paradigm’s Smart Board is entirely free, with no hidden costs or limitations on its features.
Conclusion
Root Cause Analysis using a Fishbone Diagram is a powerful method for identifying and addressing the underlying causes of problems. Visual Paradigm’s Smart Board enhances this process by providing a user-friendly, collaborative, and interactive platform for creating and analyzing Fishbone Diagrams. Whether you are investigating training program failures, project delays, or any other complex issues, Visual Paradigm’s Smart Board empowers you to perform effective root cause analysis and implement strategic improvements.
