Now Reading: Comprehensive BPMN Case Study: Water Delivery Process
-
01
Comprehensive BPMN Case Study: Water Delivery Process
Comprehensive BPMN Case Study: Water Delivery Process
Introduction to BPMN
Business Process Model and Notation (BPMN) is a standardized graphical notation used to model business processes in a clear and consistent manner. It is widely used across industries to document, analyze, and optimize workflows, ensuring stakeholders can understand and improve processes effectively. BPMN diagrams use specific symbols such as pools, lanes, events, activities, gateways, and flows to represent the sequence and interaction of activities within a process.
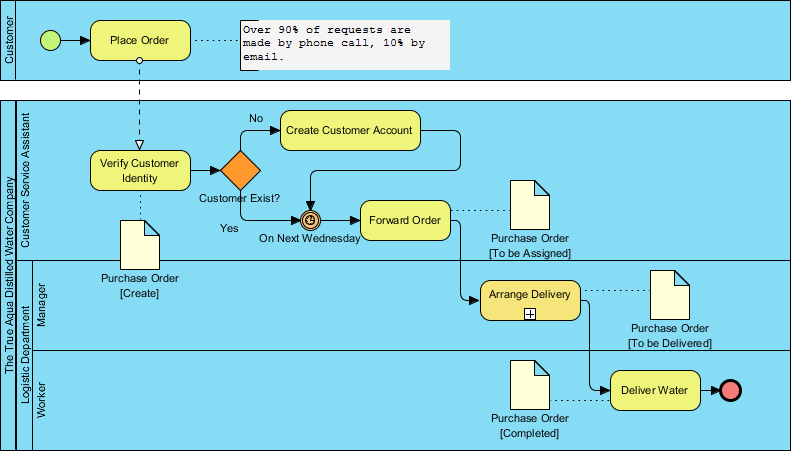
This case study focuses on a water delivery process modeled in BPMN, as shown in the provided diagram. We will explore the key concepts of BPMN, interpret the diagram, and provide a detailed analysis of the process.
Key Concepts of BPMN
-
- Pools and Lanes:
-
- Pools represent participants or organizations involved in the process. In the diagram, there are two pools: “Customer” and “True Aquila Water Company.”
-
- Lanes divide pools into subprocesses or roles within the organization. Here, the “True Aquila Water Company” pool is divided into lanes for “Customer Service Assistant,” “Logistics Manager,” and “Delivery Worker.”
-
- Pools and Lanes:
-
- Events:
-
- Events are represented by circles and indicate something that happens during the process. They can be start events (green circle with a thin border), intermediate events, or end events (red circle with a thick border).
-
- In the diagram, the start event is “Place Order” (green circle), and the end event is “Deliver Water” (red circle).
-
- Events:
-
- Activities:
-
- Activities are tasks or work performed within the process, represented by rectangles with rounded corners. Examples include “Verify Customer Identity,” “Create Customer Account,” and “Arrange Delivery.”
-
- Activities:
-
- Gateways:
-
- Gateways, shown as diamonds, control the flow of the process, typically representing decisions or branching points. The diamond in the diagram labeled “Customer Exist?” is a decision point.
-
- Gateways:
-
- Sequence Flows:
-
- Arrows connect activities, events, and gateways, showing the order of execution. Solid arrows indicate the primary flow, while dashed arrows may represent message flows or optional paths.
-
- Sequence Flows:
-
- Message Flows:
-
- Dashed arrows represent the exchange of information or messages between pools or lanes. In the diagram, dashed arrows connect the “Customer” pool to the “Customer Service Assistant” lane, indicating communication (e.g., phone calls or emails).
-
- Message Flows:
-
- Artifacts:
-
- Artifacts provide additional information about the process, such as annotations or data objects. The diagram includes annotations like “Over 90% of requests are made by phone call, 10% by email” and data objects like “Purchase Order [Created],” “Purchase Order [To be Assigned],” and “Purchase Order [To be Delivered].”
-
- Artifacts:
Interpretation of the Water Delivery Process Diagram
The BPMN diagram models the process of a customer placing an order for water delivery with True Aquila Water Company. Below is a step-by-step interpretation of the process:
-
- Initiation by the Customer:
-
- The process begins with the customer initiating an order through the “Place Order” start event. The annotation indicates that over 90% of orders are placed via phone calls, with 10% via email, suggesting a preference for direct communication.
-
- Initiation by the Customer:
-
- Customer Verification by Customer Service Assistant:
-
- The order is received by the “Customer Service Assistant” lane within True Aquila Water Company.
-
- The assistant performs the “Verify Customer Identity” activity to confirm the customer’s details.
-
- A gateway (“Customer Exist?”) follows, representing a decision point:
-
- If the customer does not exist (No), a new “Create Customer Account” activity is triggered to register the customer.
-
- If the customer already exists (Yes), the process moves forward.
-
- A gateway (“Customer Exist?”) follows, representing a decision point:
-
- Customer Verification by Customer Service Assistant:
-
- Order Forwarding and Processing:
-
- After verifying or creating the customer account, the “Forward Order” activity is performed, scheduled for “On Next Wednesday,” indicating a planned delivery date.
-
- A “Purchase Order [Created]” data object is generated during this step, representing the documentation of the order.
-
- Order Forwarding and Processing:
-
- Logistics Management:
-
- The order is passed to the “Logistics Manager” lane, where the “Arrange Delivery” activity is executed. This involves coordinating the logistics for water delivery.
-
- The “Purchase Order [To be Assigned]” data object is updated to reflect the order’s status as it moves toward delivery.
-
- Logistics Management:
-
- Delivery Execution:
-
- The order is then handled by the “Delivery Worker” lane, where the “Deliver Water” end event occurs, marking the completion of the process.
-
- The “Purchase Order [To be Delivered]” and “Purchase Order [Completed]” data objects track the order’s progression and final status.
-
- Delivery Execution:
Analysis and Key Insights
-
- Process Efficiency:
-
- The process is streamlined, with clear roles (Customer Service Assistant, Logistics Manager, Delivery Worker) and a logical sequence of activities.
-
- The decision gateway (“Customer Exist?”) ensures that new customers are properly onboarded, preventing delays or errors.
-
- Process Efficiency:
-
- Communication Channels:
-
- The annotation about order placement (90% phone, 10% email) highlights the company’s reliance on direct communication, which may influence customer satisfaction and response times.
-
- Communication Channels:
-
- Scheduling and Timing:
-
- The “On Next Wednesday” annotation suggests a fixed delivery schedule, which could be a bottleneck if customers require more flexibility. This might warrant further analysis to optimize delivery timing.
-
- Scheduling and Timing:
-
- Data Management:
-
- The use of “Purchase Order” data objects at different stages (Created, To be Assigned, To be Delivered, Completed) ensures transparency and tracking throughout the process, supporting accountability and auditability.
-
- Data Management:
-
- Potential Improvements:
-
- The fixed delivery date (Next Wednesday) could be made more flexible to accommodate urgent orders.
-
- Automating the “Verify Customer Identity” and “Create Customer Account” steps with a customer portal could reduce manual effort and errors.
-
- Real-time tracking of deliveries could enhance customer experience by providing updates on order status.
-
- Potential Improvements:
Conclusion
This BPMN diagram effectively models the water delivery process at True Aquila Water Company, illustrating the interactions between the customer and various company roles. By leveraging BPMN’s standardized notation, the diagram provides a clear, visual representation of the workflow, making it easier to identify inefficiencies, optimize processes, and ensure all stakeholders understand their responsibilities. The process demonstrates a balance of manual and structured tasks, with room for technological enhancements to improve efficiency and customer satisfaction.
This case study underscores the power of BPMN as a tool for process modeling, analysis, and continuous improvement in business operations.
BPMN References
- Comprehensive Guide to Visual Paradigm for Business Process Modeling
- Streamlining Business Processes with Visual Paradigm’s BPMN Business Process Modeling Software
- Visual Paradigm: Your Comprehensive Solution for Integrated Enterprise Modeling
- Demystifying BPMN: A Comprehensive Guide to Business Process Modeling
- Navigating Business Processes with BPMN: A Visual Odyssey
- Visual Paradigm: The Ultimate All-in-One Visual Modeling Platform for Enterprise Architecture and Software Design
- Top Visual Paradigm Tools for Business Process Modeling
- Visual Paradigm: The Premier Tool for ArchiMate EA Modeling
- Mastering Visual Paradigm’s BPMN Tool: A Step-by-Step Learning Guide
- Simplify Business Process Modeling with Visual Paradigm’s BPMN Tools
- BPMN — Quick Guide
- BPMN in a Nutshell — with Free Online BPMN Tool & Examples
- A Comprehensive Guide to BPMN
- Modeling As-Is and To-Be Processes
- How to Perform Gap Analysis with BPMN?
- Visual Paradigm: A Comprehensive Suite for IT Project Development and Digital Transformation