Now Reading: Understanding Business Process Model and Notation: A Visual Approach
-
01
Understanding Business Process Model and Notation: A Visual Approach
Understanding Business Process Model and Notation: A Visual Approach
Introduction
Business Process Model and Notation (BPMN) is a powerful tool for visually representing business processes in a standardized manner. It provides a clear and concise way to map out the sequence of activities, decisions, and events that occur within a process, making it easier for stakeholders to understand and analyze workflows. BPMN uses a set of graphical elements to depict various aspects of a process, from simple tasks to complex decision points and parallel activities. This guide will explore the basic elements of BPMN through examples, helping you understand how to create and interpret BPMN diagrams effectively. By mastering BPMN, organizations can improve process efficiency, identify bottlenecks, and enhance communication among team members.
Basic BPMN Elements
-
Events
- Start Event: Represented by a small circle, it indicates where a process starts.
- End Event: Represented by a bold circle, it indicates where a process ends.
- Intermediate Event: Represented by a double circle, it indicates something that happens between the start and end events.
-
Activities
- Task: Represented by a rounded-corner rectangle, it indicates a single unit of work.
- Sub-Process: Represented by a rectangle with a plus sign inside, it indicates a process within a process.
-
Gateways
- Exclusive Gateway (XOR): Represented by a diamond shape with an “X” inside, it indicates a decision point where only one path can be taken.
- Inclusive Gateway (OR): Represented by a diamond shape with an “O” inside, it indicates a decision point where one or more paths can be taken.
- Parallel Gateway (AND): Represented by a diamond shape with a “+”, it indicates a point where multiple paths are executed simultaneously.
-
Flow Objects
- Sequence Flow: Represented by solid arrows, it shows the order of activities.
- Message Flow: Represented by dashed arrows, it shows the flow of messages between different participants.
-
Artifacts
- Data Objects: Represented by a folded corner rectangle, it indicates data required or produced by a task.
- Groups: Represented by a dashed rounded rectangle, it groups related activities.
- Annotations: Represented by a small rectangle with a folded corner, it provides additional information about a process element.
Example Analysis
Example 1: Flow Arrows
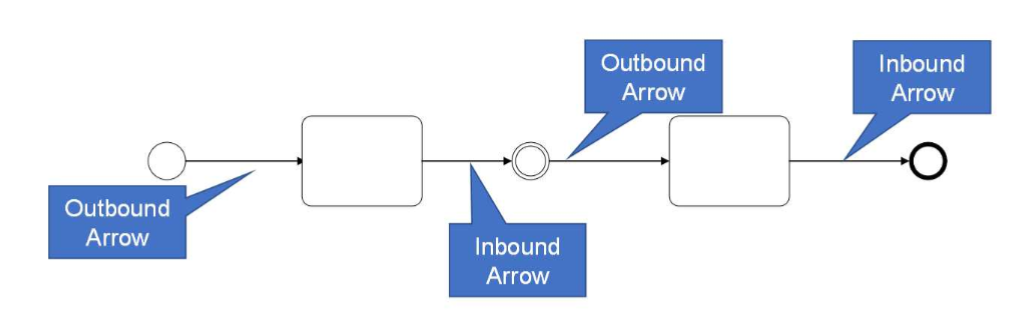
- Outbound Arrow: Indicates the direction of the sequence flow from one element to another.
- Inbound Arrow: Indicates the direction of the sequence flow coming into an element.
- Sequence Flow: Arrows show the order in which activities are performed.
Example 2: Teaching Process
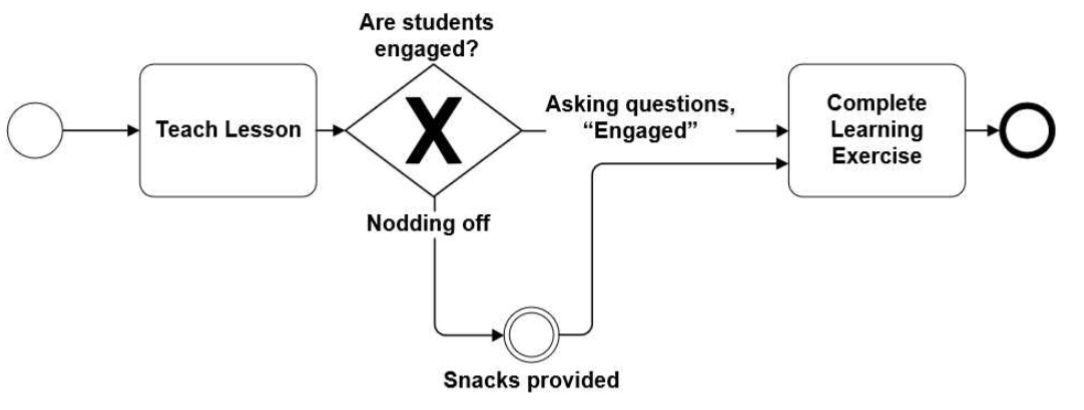
- Start Event: The process begins with teaching a lesson.
- Task: “Teach Lesson” is a task represented by a rounded-corner rectangle.
- Exclusive Gateway: The diamond with an “X” represents a decision point where the process checks if students are engaged.
- If students are engaged, the process moves to “Asking questions, Engaged”.
- If students are not engaged (nodding off), snacks are provided.
- End Event: The process ends with “Complete Learning Exercise”.
Creating a BPMN Diagram
- Identify the Process: Determine the scope and boundaries of the process you want to model.
- Define Activities: List all the tasks and sub-processes involved.
- Determine Events: Identify start, intermediate, and end events.
- Add Gateways: Include decision points where the process can branch.
- Connect with Flows: Use sequence flows to connect events, activities, and gateways.
- Add Artifacts: Include any necessary data objects, groups, or annotations.
Best Practices
- Clarity: Ensure the diagram is clear and easy to understand.
- Consistency: Use BPMN symbols consistently throughout the diagram.
- Simplicity: Keep the diagram as simple as possible while still conveying the necessary information.
- Validation: Review the diagram with stakeholders to ensure accuracy.
By following this guide and using the examples provided, you can create effective BPMN diagrams to model and communicate business processes clearly and efficiently.
Conclusion
BPMN offers a structured approach to modeling business processes, enabling organizations to visualize and optimize their workflows. By using standardized symbols and flows, BPMN diagrams provide clarity and consistency, making it easier for teams to collaborate and make informed decisions. The examples discussed in this guide illustrate how BPMN can be applied to real-world scenarios, from decision-making processes in education to understanding flow directions. As you continue to explore and implement BPMN in your organization, remember to focus on clarity, simplicity, and stakeholder engagement. With practice, BPMN can become a valuable tool for driving process improvement and achieving operational excellence.
BPMN References
- Comprehensive Guide to Visual Paradigm for Business Process Modeling
- Streamlining Business Processes with Visual Paradigm’s BPMN Business Process Modeling Software
- Visual Paradigm: Your Comprehensive Solution for Integrated Enterprise Modeling
- Demystifying BPMN: A Comprehensive Guide to Business Process Modeling
- Navigating Business Processes with BPMN: A Visual Odyssey
- Visual Paradigm: The Ultimate All-in-One Visual Modeling Platform for Enterprise Architecture and Software Design
- Top Visual Paradigm Tools for Business Process Modeling
- Visual Paradigm: The Premier Tool for ArchiMate EA Modeling
- Mastering Visual Paradigm’s BPMN Tool: A Step-by-Step Learning Guide
- Simplify Business Process Modeling with Visual Paradigm’s BPMN Tools
- BPMN — Quick Guide
- BPMN in a Nutshell — with Free Online BPMN Tool & Examples
- A Comprehensive Guide to BPMN
- Modeling As-Is and To-Be Processes
- How to Perform Gap Analysis with BPMN?
- Visual Paradigm: A Comprehensive Suite for IT Project Development and Digital Transformation
- Introduction to BPMN Part I – Visual Paradigm
- BPMN Tutorial with Example – The Leave Application Process
- How to Draw BPMN Diagram?
- BPMN Activity Types Explained
- How to Create BPMN Diagram?
- How to Develop As-Is and To-Be Business Process?
- How to Draw BPMN 2.0 Business Process Diagram?
- Introduction to BPMN Part IV – Data and Artifacts
- Introduction to BPMN Part III – Flow and Connecting Objects
- How to Draw BPMN Conversation Diagram?
- Business Process Diagram Example: Sequence
- Business Process Diagram Example: The Nobel Prize