Now Reading: Comprehensive Guide to Flowcharts: Understanding and Creating Flowcharts
-
01
Comprehensive Guide to Flowcharts: Understanding and Creating Flowcharts
Comprehensive Guide to Flowcharts: Understanding and Creating Flowcharts
Introduction to Flowcharts
Flowcharts are visual representations of processes, algorithms, or workflows. They use standardized symbols and arrows to illustrate the sequence of steps, decisions, and actions involved in a process. Flowcharts are widely used in various fields, including software development, business process management, and engineering, to simplify complex processes and improve communication among stakeholders.
Key Components of Flowcharts
Flowcharts consist of several key components, each represented by specific shapes and symbols:
- Start/End: Represented by an oval or rounded rectangle, these symbols indicate the beginning and end of a process.
- Process: Represented by a rectangle, this symbol denotes a specific task or action within the process.
- Decision: Represented by a diamond, this symbol indicates a point where a decision is made, leading to different paths based on the outcome.
- Input/Output: Represented by a parallelogram, this symbol denotes input or output operations.
- Flow Lines: Arrows that connect the symbols, showing the direction of the process flow.
Example Flowchart: Calculating the Sum of Two Numbers
Let’s walk through an example flowchart that calculates the sum of two numbers and prints the result. This example will illustrate the key components and steps involved in creating a flowchart.
Step-by-Step Explanation
-
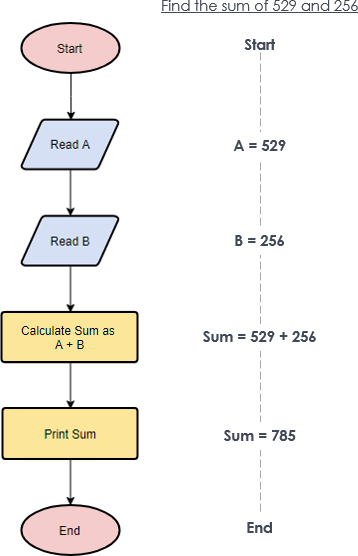
Start: The flowchart begins with a “Start” symbol, indicating the initiation of the process.
-
Read A: The first process step is to read the value of variable A. This is represented by a rectangle labeled “Read A.”
-
Read B: The next process step is to read the value of variable B. This is represented by another rectangle labeled “Read B.”
-
Calculate Sum: The process then moves to a decision point where the sum of A and B is calculated. This is represented by a diamond labeled “Calculate Sum as A + B.”
-
Print Sum: After calculating the sum, the process proceeds to print the result. This is represented by a rectangle labeled “Print Sum.”
-
End: The flowchart concludes with an “End” symbol, indicating the completion of the process.
Flowchart Diagram
Detailed Explanation of Each Step
- Start: The process begins.
- Read A: The value of variable A is read and stored. For example, A = 529.
- Read B: The value of variable B is read and stored. For example, B = 256.
- Calculate Sum: The sum of A and B is calculated. Sum = 529 + 256 = 785.
- Print Sum: The calculated sum is printed. Print Sum = 785.
- End: The process ends.
Benefits of Using Flowcharts
Flowcharts offer several benefits, including:
- Clarity: They provide a clear and concise visual representation of complex processes, making them easier to understand.
- Communication: Flowcharts facilitate better communication among team members by providing a common language for discussing processes.
- Efficiency: They help identify inefficiencies and bottlenecks in processes, leading to improved performance.
- Documentation: Flowcharts serve as valuable documentation for training, auditing, and compliance purposes.
Conclusion
Flowcharts are essential tools for visualizing and understanding processes. By breaking down complex workflows into simple, standardized symbols, flowcharts enhance clarity, communication, and efficiency. Whether you are a software developer, business analyst, or engineer, mastering the art of creating flowcharts can significantly improve your ability to manage and optimize processes. The example provided in this article demonstrates the steps involved in creating a flowchart, from start to end, and highlights the key components and benefits of using flowcharts in various applications.
Reference
- Online Flowchart Tool – Visual Paradigm’s online flowchart tool is described as the easiest and most powerful in the world, allowing users to create diagrams quickly and collaboratively. It supports creating flowcharts from scratch or using templates.
- Flowchart Tutorial (with Symbols, Guide and Examples) – This tutorial provides a step-by-step guide on how to draw flowcharts using Visual Paradigm. It covers the basics of flowcharts, their symbols, and examples to help users understand and create flowcharts effectively.
- Free Online Flowchart Maker – Visual Paradigm Online offers a free flowchart maker with an intuitive drag-and-drop editor. It includes extensive built-in templates and allows users to create professional flowcharts quickly and easily.
- Flowchart Templates – This resource provides a variety of free online flowchart templates and examples. Users can sign up to create a free online workspace and start designing professional flowcharts using Visual Paradigm’s online flowchart maker.
- Flowchart Tutorial – This tutorial covers what a flowchart is, how to create one, and when to use it. It includes flowchart examples and tips, helping users learn about flowcharts and how to draw them step-by-step using Visual Paradigm.
- Easy-to-Use Flowchart Maker – Visual Paradigm is highlighted as an intuitive and powerful flowchart software, ideal for users who need a reliable and easy-to-use tool for creating visually appealing flowcharts quickly.
- Free Online Flowchart Editor – Visual Paradigm Online features a state-of-the-art online flowchart editor that allows users to create flowcharts flexibly and simply. It supports various diagram types, including mind maps, org charts, UML, ERD, and floor plans.
- Web-Based Free Flowchart Maker – This web-based flowchart maker by Visual Paradigm Online supports creating professional and beautiful flowcharts online. It offers drag-and-drop functionality, alignment tools, grouping, and formatting tools for easy diagramming.
- Free Flowchart Tool – Visual Paradigm Online offers a free flowchart tool that allows users to create exceptional flowcharts online. It supports inserting text, external graphics, and links, making flowcharts rich in content and visually tidy.
