Now Reading: Creating Concept Maps Using Visual Paradigm Smart Board
-
01
Creating Concept Maps Using Visual Paradigm Smart Board
Creating Concept Maps Using Visual Paradigm Smart Board
Visual Paradigm Smart Board is a versatile and free tool designed to help users create various diagrams, including mind maps and concept maps, to organize ideas and information visually. This guide will walk you through the key features and steps to create effective concept maps using Visual Paradigm Smart Board.
Key Features of Visual Paradigm Smart Board
Free Access
Visual Paradigm Smart Board is completely free to use, with no hidden charges. This makes it an accessible tool for anyone looking to start mind mapping without any cost barriers.
Various Diagram Types
The tool supports multiple diagram types, including:
- Mind Maps: Ideal for brainstorming, project planning, and organizing thoughts.
- Concept Maps: Useful for representing relationships between ideas and concepts, aiding in clarity, understanding, and collaboration.
- Bubble Maps: Great for prioritizing tasks or ideas, visualizing data, and comparing different factors.
- Organizational Charts: For structuring hierarchical data.
- Tree Charts: Useful for visualizing hierarchical data and planning projects.
- Fishbone Diagrams: Helpful for identifying root causes and improving processes.
Concept Maps
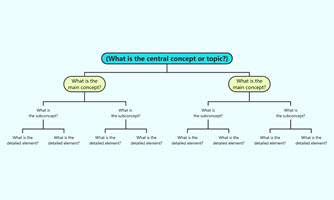
Concept maps are graphical tools that represent relationships between ideas and concepts. They are particularly useful in strategic planning and effective communication in business settings.
Mind Maps
Mind maps are perfect for brainstorming, project planning, and organizing thoughts. They provide a visual representation of ideas and concepts, making it easier to see the big picture.
Text to Mind Map
Visual Paradigm Smart Board allows users to transform text into a structured mind map using the outline feature. Changes made in the outline are dynamically reflected in the mind map, adjusting the arrangement and connection of nodes automatically.
Node Management
- Sibling Nodes: Add nodes at the same hierarchical level by pressing the “Enter” key.
- Child Nodes: Add nodes positioned below the current node using the “Tab” key.
- Hierarchy Control: Easily manage the hierarchy and layering of sibling nodes.
Customization
Customize the appearance of your mind maps with various styles, fonts, colors, and formatting options. Adjust node styles, margins, and themes to fit your preferences.
Text Editor
The tool provides an option to enlarge the text editor for easier input and editing, making it convenient to work with large amounts of text.
Cloud Storage
Store your mind maps in the cloud for easy access, collaboration, and sharing with others.
Templates
Visual Paradigm Smart Board offers a variety of templates to help you get started quickly. These include templates for concept maps, family trees, org charts, and more.
Visual Appeal
The tool is designed to enhance your creativity with well-designed structures and styles, making your mind maps visually appealing and engaging.
Exporting
Easily export your mind maps as images for presentations, reports, or sharing with colleagues.
Steps to Create a Concept Map
-
Sign Up and Log In: Create a free account on Visual Paradigm Smart Board and log in to access the tool.
-
Choose a Diagram Type: Select “Concept Map” from the available diagram types to start creating your concept map.
-
Use Templates: Browse through the available templates and choose one that fits your needs. This will give you a head start on your concept map.
-
Add Nodes: Start by adding the main concept as the central node. Use the “Enter” key to add sibling nodes and the “Tab” key to add child nodes.
-
Connect Nodes: Draw connections between nodes to represent relationships and hierarchies. Use labels to describe the relationships clearly.
-
Customize Appearance: Customize the appearance of your concept map by adjusting styles, fonts, colors, and themes. Make sure your map is visually appealing and easy to understand.
-
Use the Text Editor: If you have a lot of text to input, use the text editor feature to make the process easier. Changes made in the text editor will be reflected in the concept map.
-
Save and Share: Save your concept map to the cloud for easy access and sharing. You can also export it as an image for presentations or reports.
Example of a Concept Map
Let’s say you are creating a concept map for a project on “Climate Change.”
- Central Node: “Climate Change”
- Sibling Nodes: “Causes,” “Effects,” “Solutions”
- Child Nodes:
- Under “Causes”: “Greenhouse Gases,” “Deforestation,” “Industrialization”
- Under “Effects”: “Rising Temperatures,” “Sea Level Rise,” “Extreme Weather”
- Under “Solutions”: “Renewable Energy,” “Reforestation,” “Sustainable Practices”
By following these steps and utilizing the features of Visual Paradigm Smart Board, you can create effective and visually appealing concept maps to organize and communicate your ideas clearly.
Visual Paradigm Smart Board is a powerful tool that promotes visual thinking to solve problems and organize ideas. By understanding and using the various diagram types it offers, you can communicate complex information clearly and effectively.
Try it Yourself
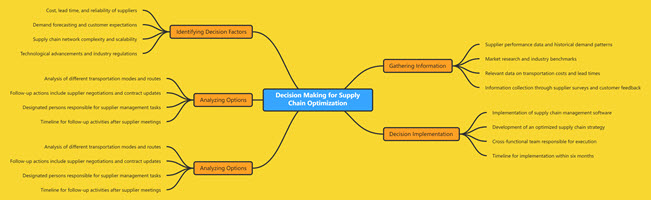
Decision Making for Supply Chain Optimization
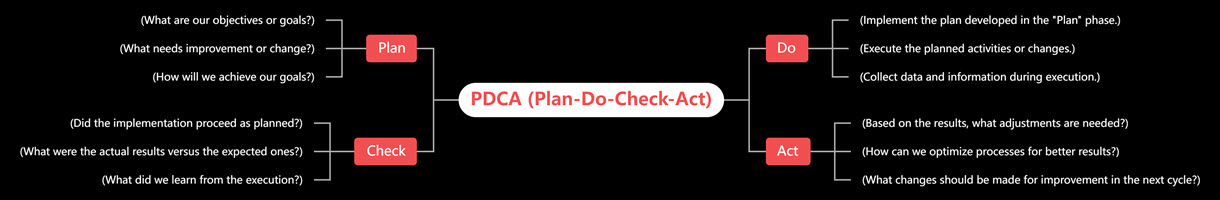
PDCA (Plan-Do-Check-Act)
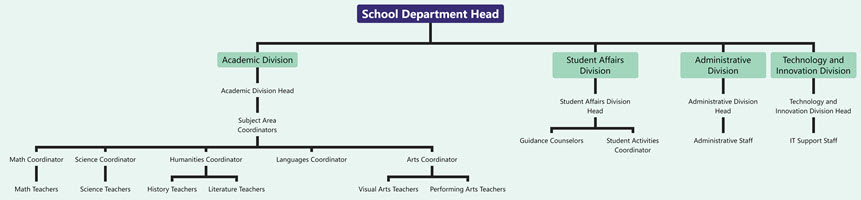
Organizational Chart of School Department
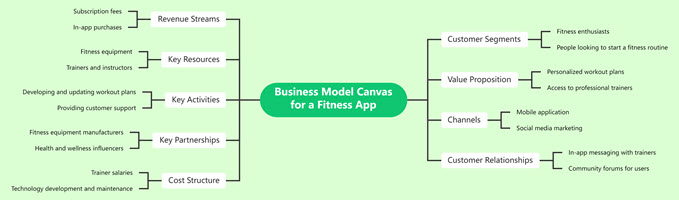
Business Model Canvas for a Fitness App
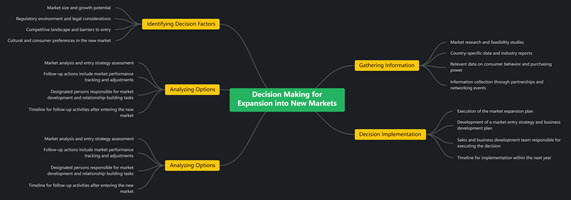
Decision Making for Expansion into New Markets
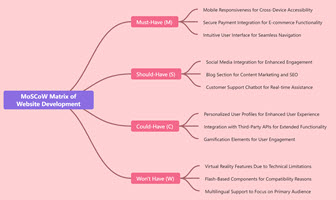
MoSCoW Matrix of Website Development
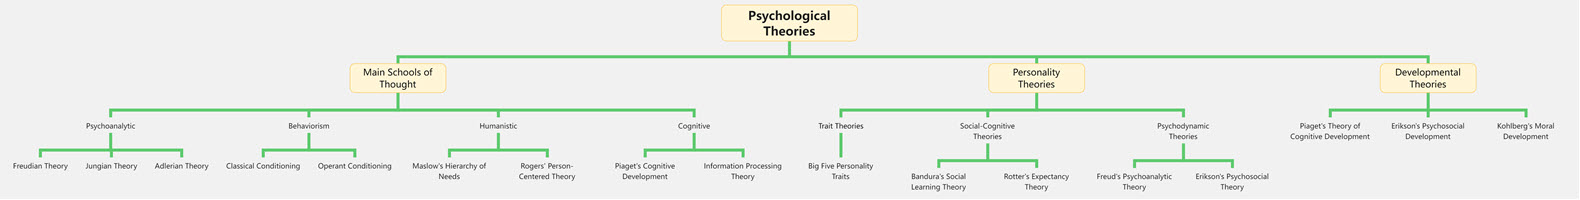
Tree Chart of Psychological Theories
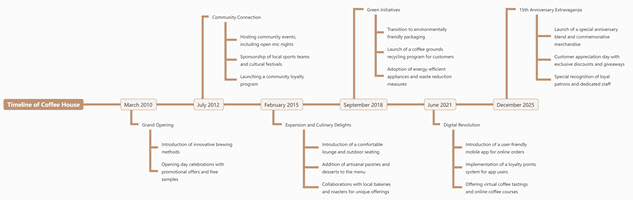
Timeline of Coffee House

PEST Analysis For the Automobile Industry
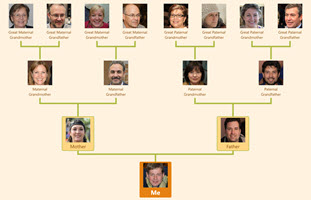
Family Tree With Photo
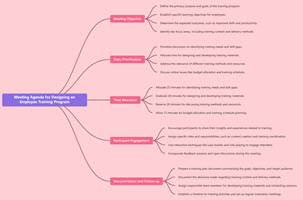
Meeting Agenda for Designing an Employee Training Program
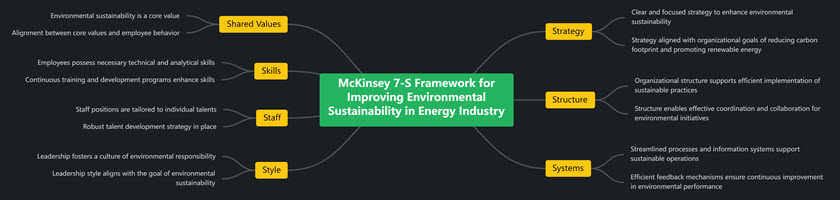
McKinsey 7-S Framework for Improving Environmental Sustainability in Energy Industry
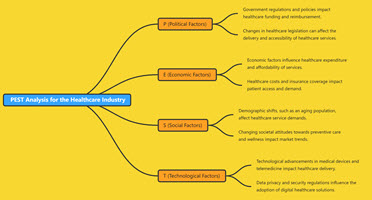
PEST Analysis for the Healthcare Industry

PDCA for improving on-time delivery in a logistics company
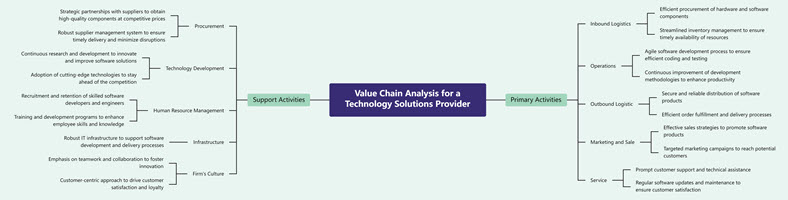
Value Chain Analysis for a Technology Solutions Provider
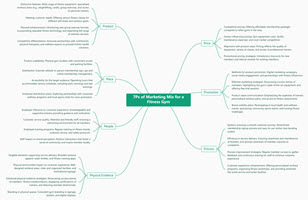
7Ps of Marketing Mix for a Fitness Gym
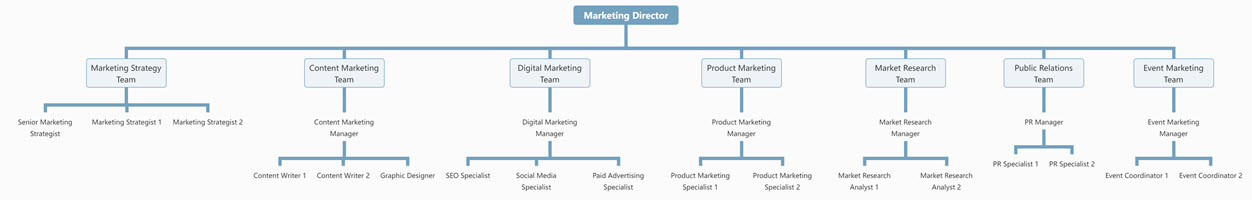
Organizational Chart of Marketing Team
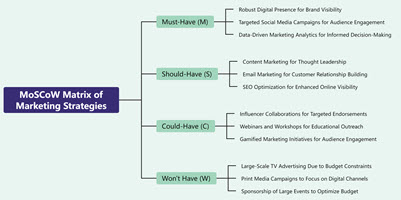
MoSCoW Matrix of Marketing Strategies
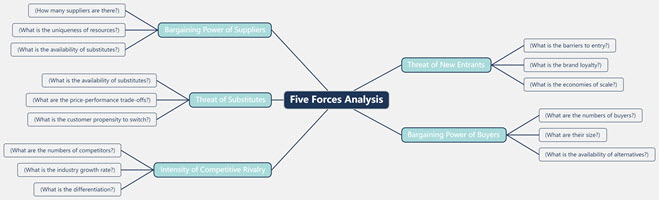
Five Forces Analysis
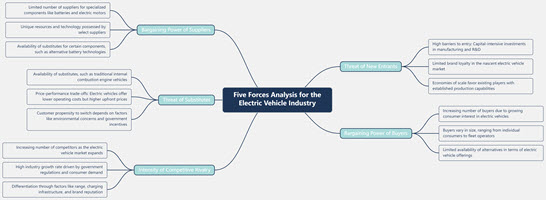
Five Forces Analysis for the Electric Vehicle Industry
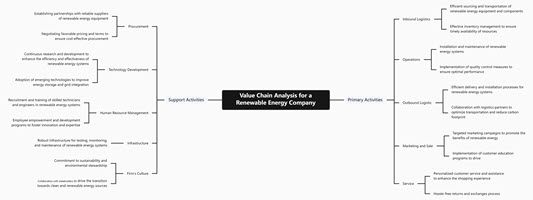
Value Chain Analysis for a Renewable Energy Company

Tree Chart of Mathematics
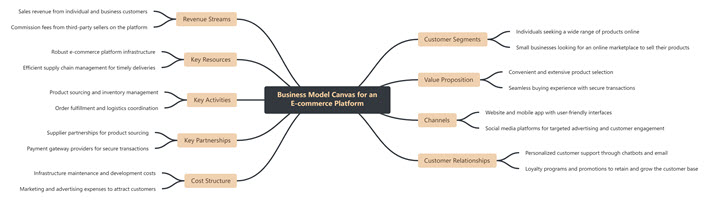
Business Model Canvas for an E-commerce Platform
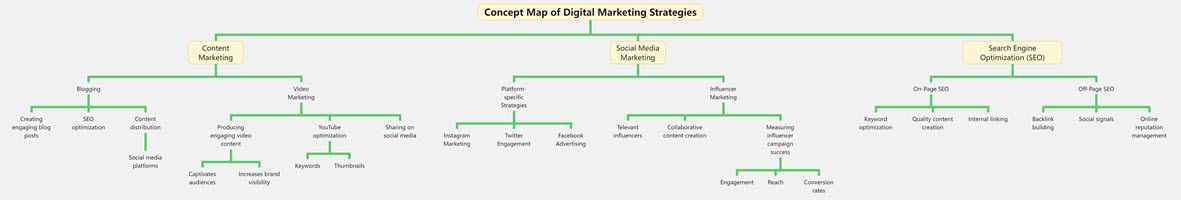
Concept Map of Digital Marketing Strategies
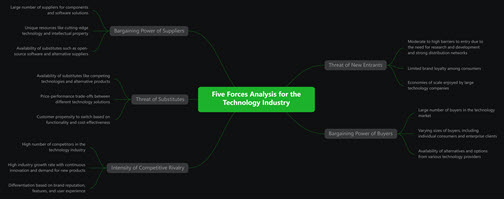
Five Forces Analysis for the Technology Industry
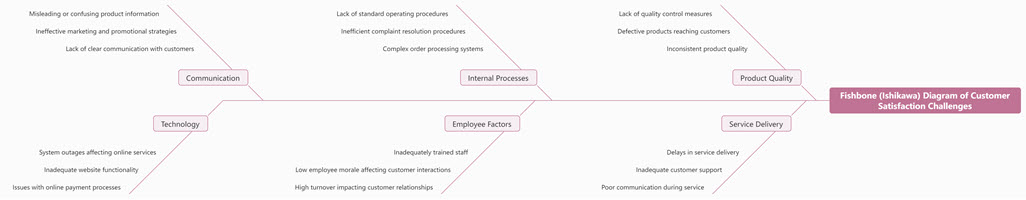
Fishbone (Ishikawa) Diagram of Customer Satisfaction Challenges
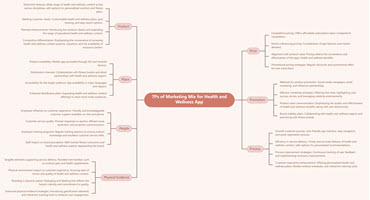
7Ps of Marketing Mix for Health and Wellness App
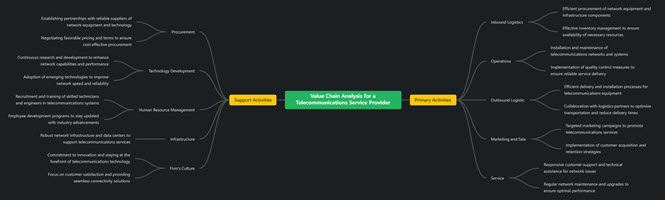
Value Chain Analysis for a Telecommunications Service Provider
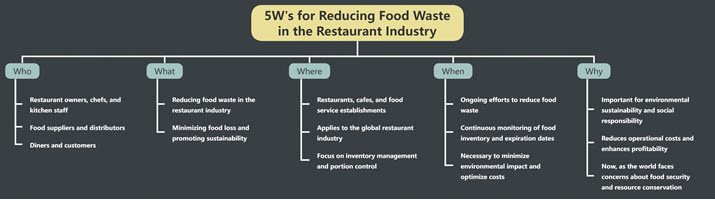
5W’s for Reducing Food Waste in the Restaurant Industry
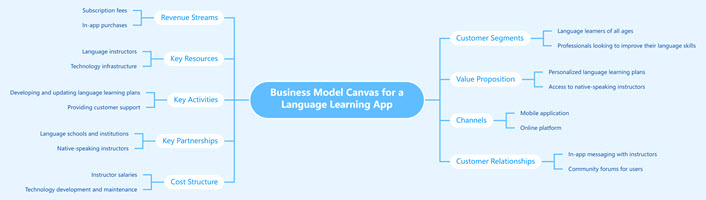
Business Model Canvas for a Language Learning App
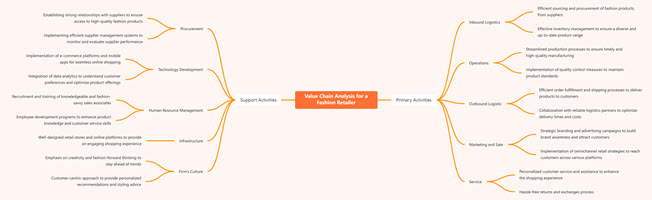
Value Chain Analysis for a Fashion Retailer
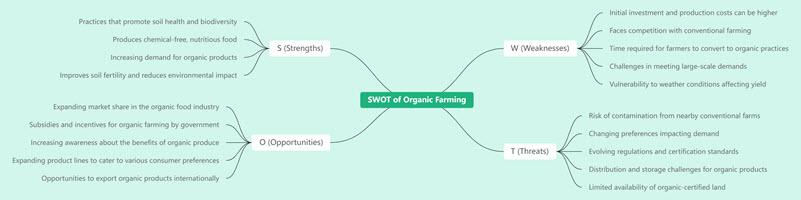
SWOT of Organic Farming
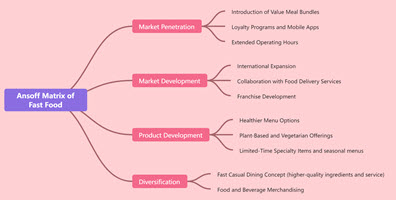
Ansoff Matrix of Fast Food
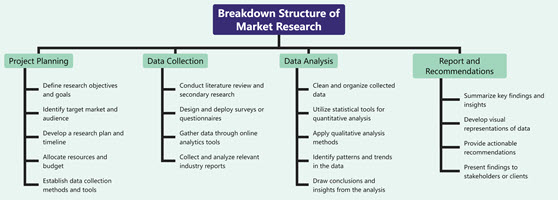
Breakdown Structure of Market Research
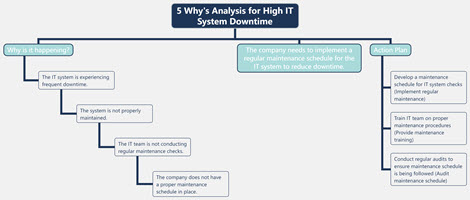
5 Why’s Analysis for High IT System Downtime
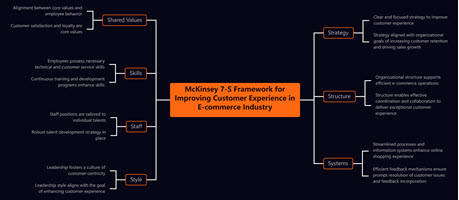
McKinsey 7-S Framework for Improving Customer Experience in E-commerce Industry
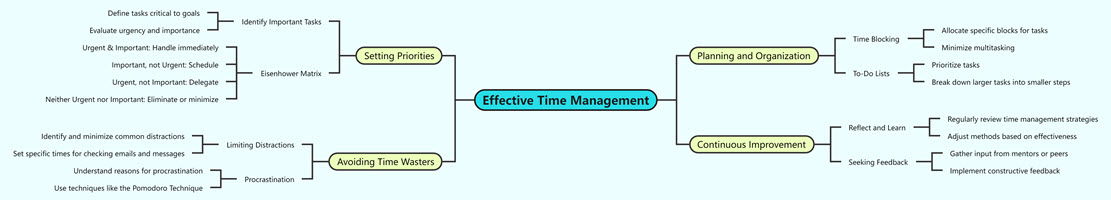
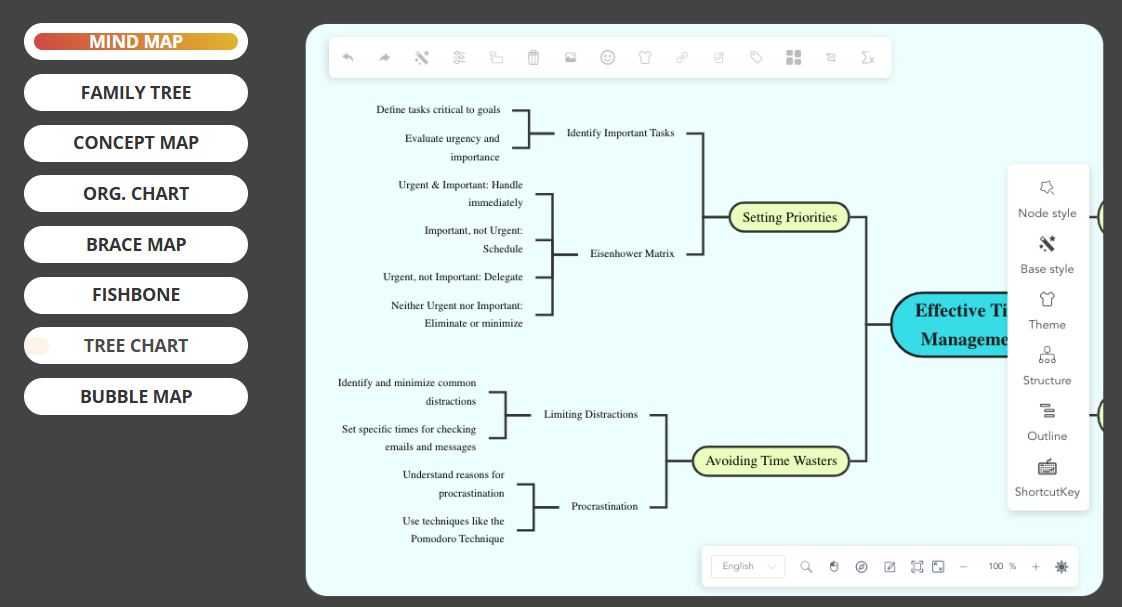
Mind Map of Effective Time Management
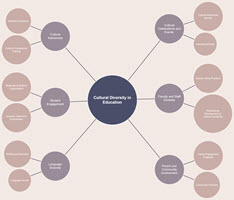
Bubble Map of Cultural Diversity in Education
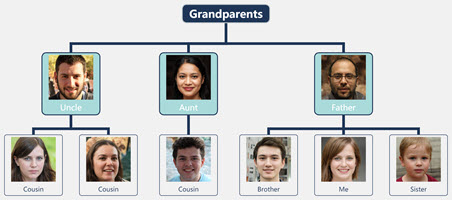
Paternal Family Tree
Concept Map
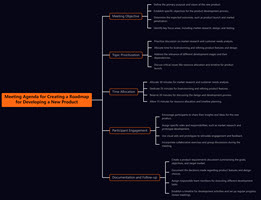
Meeting Agenda for Creating a Roadmap for Developing a New Product
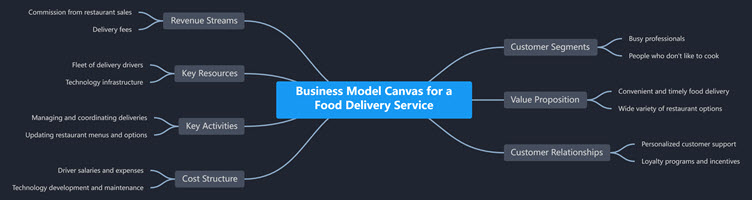
Business Model Canvas for a Food Delivery Service
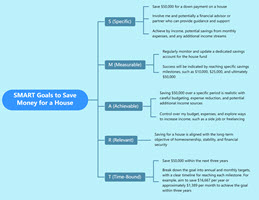
SMART Goals to Save Money for a House
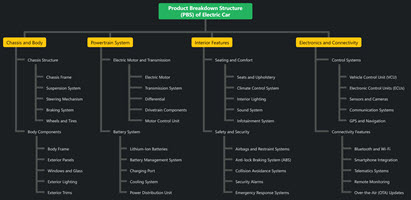
Product Breakdown Structure (PBS) of Electric Car

