Now Reading: Tutorial on Five Forces Analysis with a Case Study
-
01
Tutorial on Five Forces Analysis with a Case Study
Tutorial on Five Forces Analysis with a Case Study
Introduction to Five Forces Analysis
Five Forces Analysis is a strategic framework developed by Michael E. Porter to assess the competitive dynamics within an industry. This framework helps businesses understand the forces that shape their competitive landscape, enabling them to make informed strategic decisions. The five forces are:

- Threat of New Entrants
- Bargaining Power of Suppliers
- Bargaining Power of Buyers
- Threat of Substitutes
- Rivalry Among Existing Competitors
This tutorial will walk you through each of the five forces and provide a case study based on the image provided.
The Five Forces
1. Threat of New Entrants
The threat of new entrants refers to the ease with which new competitors can enter the market. Factors to consider include:
- Barriers to Entry: High barriers (e.g., regulations, capital requirements) reduce the threat.
- Economies of Scale: Industries with significant economies of scale are less attractive to new entrants.
- Brand Loyalty: Strong brand loyalty makes it harder for new entrants.
- Customer Switching Costs: High switching costs reduce the threat of new entrants.
- Access to Distribution Channels: Difficulty in setting up distribution channels can deter new entrants.
- Retaliation from Existing Competitors: High threat of retaliation can discourage new entrants.
Key Questions:
- What are the barriers to entry?
- What are the economies of scale?
- What is the brand loyalty?
- What are the customer switching costs?
- How difficult is it to set up distribution channels?
- What is the threat of retaliation from existing competitors?
2. Bargaining Power of Suppliers
The bargaining power of suppliers refers to the influence suppliers have over the terms and conditions of supplying goods or services to an industry. Factors to consider include:
- Number of Suppliers: Fewer suppliers mean higher bargaining power.
- Uniqueness of Resources: Suppliers with unique or scarce resources have more power.
- Switching Costs: High switching costs for buyers increase supplier power.
- Segmentation: Highly segmented suppliers have more power.
Key Questions:
- How many suppliers are there?
- What is the uniqueness of resources?
- What are the switching costs for buyers?
- How segmented are the suppliers?
3. Bargaining Power of Buyers
The bargaining power of buyers refers to the influence customers have over the terms and conditions of purchasing goods or services. Factors to consider include:
- Number of Buyers: Fewer buyers mean higher bargaining power.
- Size of Buyers: Larger buyers have more power.
- Standardization of Products: Highly standardized products increase buyer power.
- Order Size: Very large orders increase buyer power.
- Price Sensitivity: High price sensitivity increases buyer power.
- Integration Threat: Buyers with the threat of integrating forward into the supplier’s industry have more power.
Key Questions:
- What are the numbers of buyers?
- What are their sizes?
- How standardized are the products?
- What is the order size?
- What is the price sensitivity?
- What is the threat of integration?
4. Threat of Substitutes
The threat of substitutes refers to the likelihood of customers switching to alternative products or services. Factors to consider include:
- Availability of Substitutes: The more substitutes available, the higher the threat.
- Switching Costs: Low switching costs increase the threat of substitutes.
- Relative Performance: Substitutes that offer better performance are more threatening.
Key Questions:
- What is the availability of substitutes?
- What are the switching costs?
- What is the relative performance of substitutes?
5. Rivalry Among Existing Competitors
The intensity of competitive rivalry refers to the level of competition among existing firms in the industry. Factors to consider include:
- Number of Competitors: More competitors mean higher rivalry.
- Industry Growth Rate: Slow growth increases competition.
- Differentiation: Industries with low differentiation have higher rivalry.
- Switching Costs for Customers: Low switching costs increase rivalry.
- High Fixed Costs: High fixed costs increase rivalry.
- Exit Barriers: High exit barriers increase rivalry.
Key Questions:
- What are the numbers of competitors?
- What is the industry growth rate?
- What is the differentiation?
- What are the switching costs for customers?
- What are the fixed costs?
- What are the exit barriers?
Case Study: Analysis Based on the Image
Let’s analyze the image provided using the Five Forces framework.
1. Threat of New Entrants
- Experience Needed to Enter the Industry: High experience required reduces the threat.
- Access to R&D Talent: Limited access to R&D talent increases the barrier.
- Economies of Scale: Significant economies of scale make it difficult for new entrants.
- Technology Protection: Lack of technology protection increases the threat.
- Customer Switching Costs: Low switching costs make it easier for new entrants.
- Distribution Channels: Difficulty in setting up distribution channels deters new entrants.
- Retaliation from Competitors: High threat of retaliation from existing competitors.
2. Bargaining Power of Suppliers
- Group of Suppliers Dependent on the Company: Suppliers dependent on the company have less power.
- Switching Costs for the Company: High switching costs for the company increase supplier power.
- Segmentation: Highly segmented suppliers have more power.
3. Bargaining Power of Buyers
- Group of Suppliers Dependent on the Company: Buyers dependent on the company have less power.
- Standardization of Products: Highly standardized products increase buyer power.
- Order Size: Very large orders increase buyer power.
- Homogeneity of Products: Homogeneous products increase buyer power.
- Price Sensitivity: Extreme price sensitivity increases buyer power.
- Integration Threat: Suppliers do not threaten to integrate forward into the buyer’s industry.
4. Threat of Substitutes
- Switching Quantum of Buyers: High switching quantum of smartphone buyers increases the threat.
- Relative Performance of Substitutes: Relative performance of substitutes is much better, increasing the threat.
5. Rivalry Among Existing Competitors
- Number of Competitors: Few, but intense competition (e.g., Apple, Samsung, Google).
- Switching Costs for Customers: High switching costs for Nokia.
- Consumer Loyalty: Low-moderate consumer loyalty.
- Growth Strategies: Competitors are pursuing aggressive growth strategies.
- Cost of Leaving Market: High cost of leaving the market increases rivalry.
Strategic Implications
Based on the analysis, here are some strategic implications for the company:
- Focus on Innovation: Continuous R&D to maintain a competitive edge and reduce the threat of new entrants.
- Strengthen Brand Loyalty: Enhance brand loyalty to reduce the bargaining power of buyers and the threat of substitutes.
- Build Strong Supplier Relationships: Develop strong relationships with key suppliers to secure critical components and reduce supplier power.
- Differentiate Products: Increase product differentiation to reduce competitive rivalry and the threat of substitutes.
- Improve Customer Experience: Enhance customer experience to reduce the bargaining power of buyers and increase customer loyalty.
Start from Brainstorming
Using a mind map to brainstorm the factors influencing the Five Forces Analysis and then visualizing it as an infographic is an effective approach. This method allows for a structured and visual representation of complex information, making it easier to understand and communicate. Here’s a step-by-step guide on how to do this:
Step-by-Step Guide to Using a Mind Map for Five Forces Analysis
1. Brainstorming with a Mind Map
Create a Central Node
- Start with the Industry: Place the industry name (e.g., Hospitality Industry) at the center of the mind map.
Branch Out the Five Forces
- Create Five Main Branches: Each branch represents one of the Five Forces:
- Bargaining Power of Suppliers
- Threat of New Entrants
- Threat of Substitutes
- Bargaining Power of Buyers
- Intensity of Competitive Rivalry
Add Sub-Components
- Identify Key Factors: For each force, add sub-branches to represent the key factors and considerations. For example:
- Bargaining Power of Suppliers:
- Number of suppliers
- Uniqueness of resources
- Availability of substitutes
- Threat of New Entrants:
- Barriers to entry
- Brand loyalty
- Economies of scale
- Threat of Substitutes:
- Availability of substitutes
- Price-performance trade-offs
- Customer propensity to switch
- Bargaining Power of Buyers:
- Number of buyers
- Size of buyers
- Availability of alternatives
- Intensity of Competitive Rivalry:
- Number of competitors
- Industry growth rate
- Differentiation
- Bargaining Power of Suppliers:
Include Details
- Add Notes and Icons: Provide additional details and context for each factor. Use icons or colors to highlight important points.
Review and Refine
- Collaborate and Iterate: Review the mind map with your team, updating it as new information becomes available and refining it based on feedback.
2. Visualizing as an Infographic
Choose a Tool
- Select a Design Tool: Use a design tool like Canva, Adobe Illustrator, or Visual Paradigm to create the infographic.
Structure the Infographic
- Central Theme: Place the industry name or the main theme at the center or top of the infographic.
- Sections for Each Force: Create distinct sections for each of the Five Forces, using the mind map as a guide.
Add Visual Elements
- Icons and Images: Use icons and images to represent each factor visually.
- Color Coding: Use different colors to distinguish between the five forces.
- Charts and Graphs: Incorporate charts and graphs to illustrate data and trends.
Include Text
- Headings and Subheadings: Use clear headings and subheadings for each section.
- Bullet Points: List key factors and considerations under each force.
- Annotations: Add annotations to explain complex points.
Design for Clarity
- Layout: Arrange the elements in a logical and easy-to-follow layout.
- White Space: Use white space effectively to avoid clutter.
- Fonts: Choose readable fonts and use different sizes and styles to emphasize important points.
Review and Finalize
- Feedback: Share the infographic with stakeholders for feedback.
- Final Touches: Make any necessary adjustments and finalize the design.
Case Study: Hospitality Industry
Mind Map Brainstorming
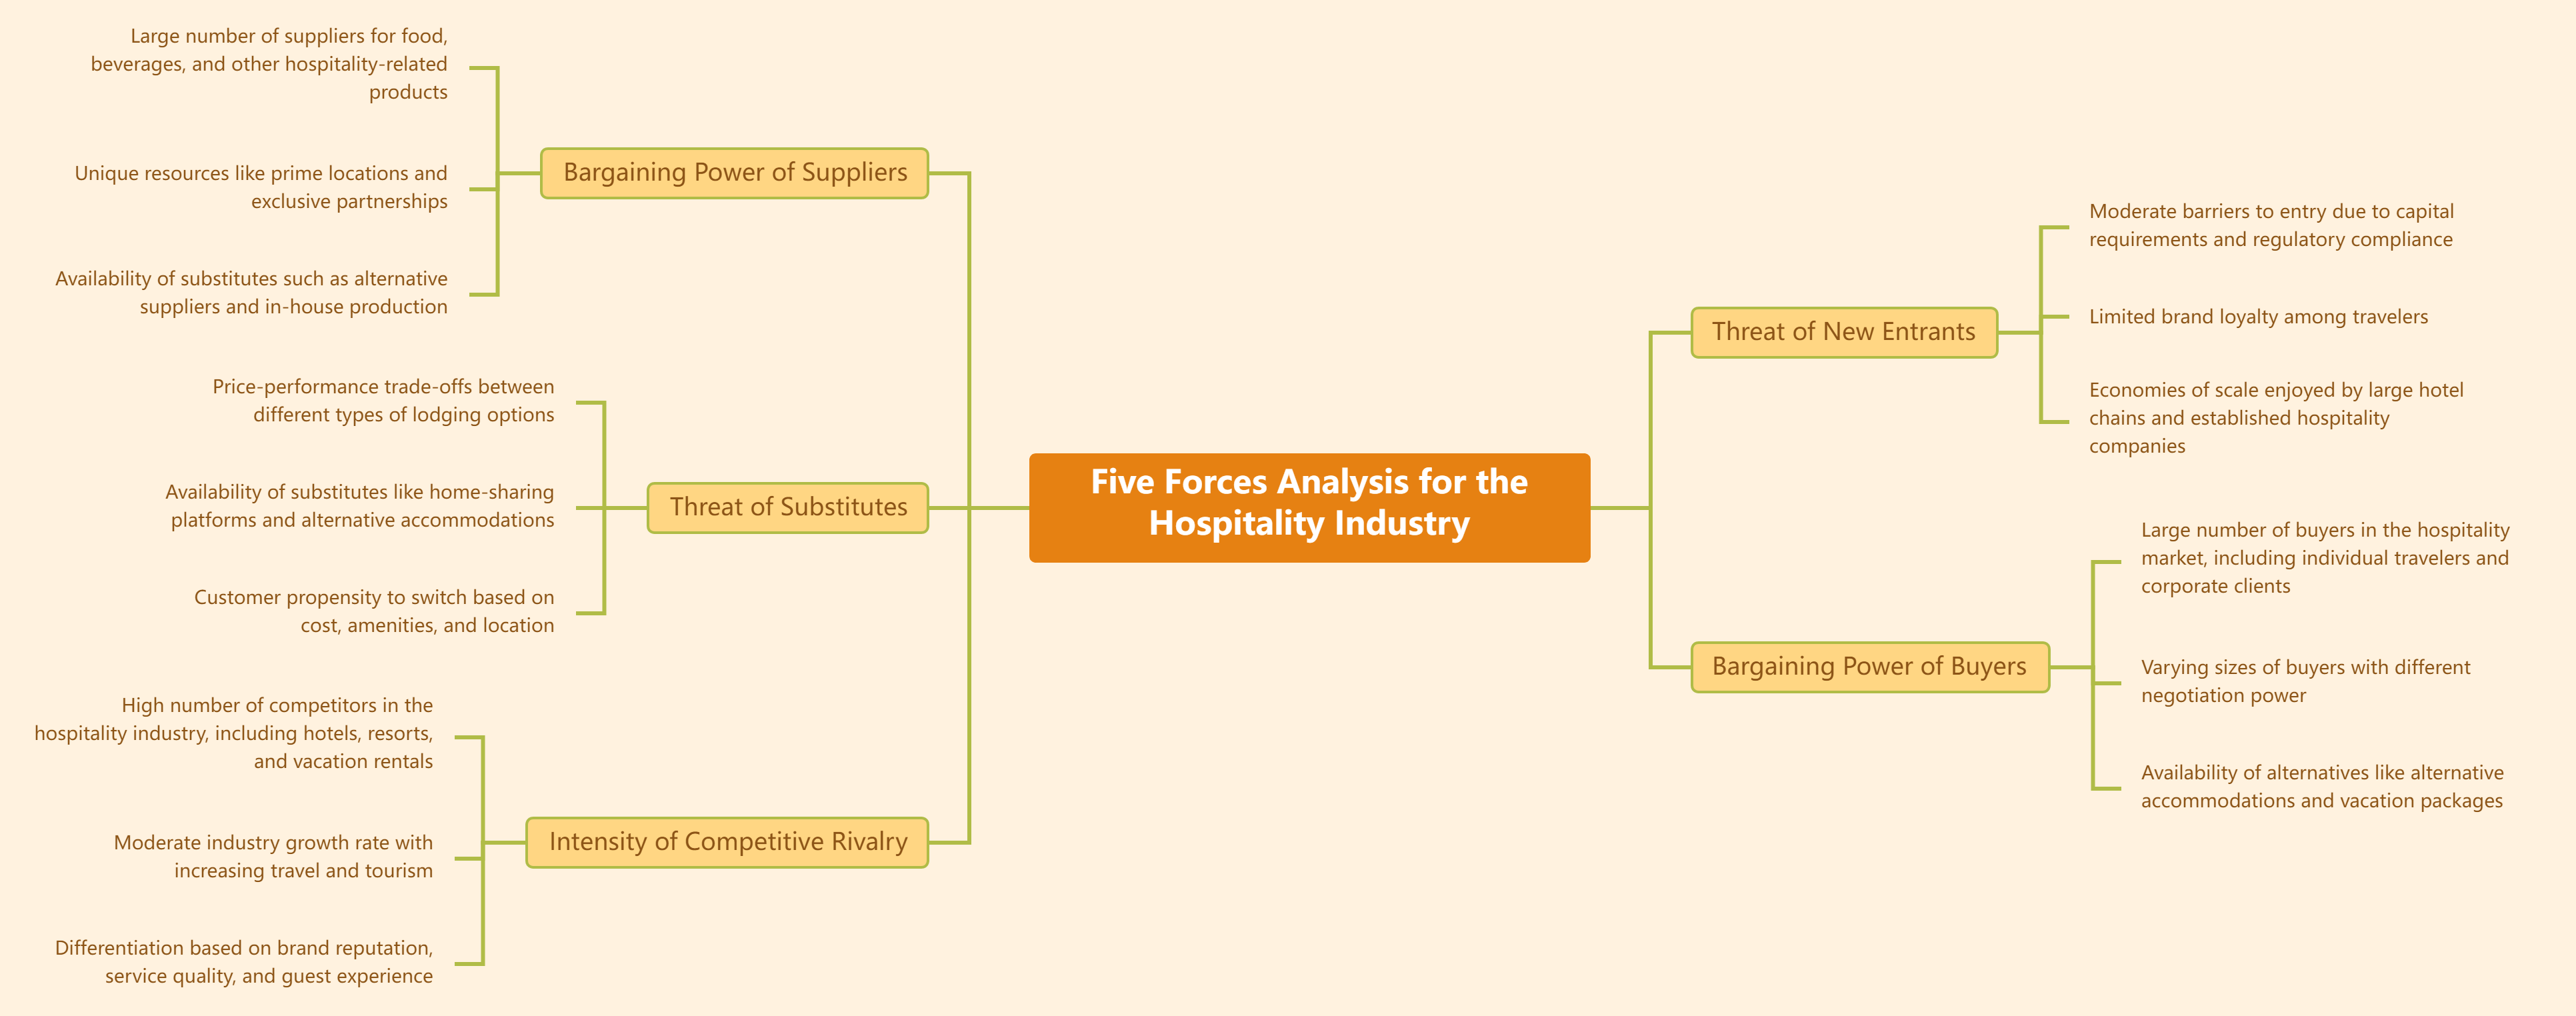
Bargaining Power of Suppliers
- Number of Suppliers: Large number of suppliers for food, beverages, and other hospitality-related products.
- Uniqueness of Resources: Unique resources like prime locations and exclusive partnerships.
- Availability of Substitutes: Availability of substitutes such as alternative suppliers and in-house production.
Threat of New Entrants
- Barriers to Entry: Moderate barriers to entry due to capital requirements and regulatory compliance.
- Brand Loyalty: Limited brand loyalty among travelers.
- Economies of Scale: Economies of scale enjoyed by large hotel chains and established hospitality companies.
Threat of Substitutes
- Availability of Substitutes: Availability of substitutes like home-sharing platforms and alternative accommodations.
- Price-Performance Trade-offs: Price-performance trade-offs between different types of lodging options.
- Customer Propensity to Switch: Customer propensity to switch based on cost, amenities, and location.
Bargaining Power of Buyers
- Number of Buyers: Large number of buyers in the hospitality market, including individual travelers and corporate clients.
- Size of Buyers: Varying sizes of buyers with different negotiation powers.
- Availability of Alternatives: Availability of alternatives like alternative accommodations and vacation packages.
Intensity of Competitive Rivalry
- Number of Competitors: High number of competitors in the hospitality industry, including hotels, resorts, and vacation rentals.
- Industry Growth Rate: Moderate industry growth rate with increasing travel and tourism.
- Differentiation: Differentiation based on brand reputation, service quality, and guest experience.
Infographic Visualization
Central Theme
- Hospitality Industry: Place the industry name at the center or top of the infographic.
Sections for Each Force
- Bargaining Power of Suppliers:
- Icons for suppliers, unique resources, and substitutes.
- Bullet points listing the key factors.
- Threat of New Entrants:
- Icons for barriers to entry, brand loyalty, and economies of scale.
- Bullet points listing the key factors.
- Threat of Substitutes:
- Icons for substitutes, price-performance trade-offs, and customer propensity to switch.
- Bullet points listing the key factors.
- Bargaining Power of Buyers:
- Icons for the number of buyers, size of buyers, and availability of alternatives.
- Bullet points listing the key factors.
- Intensity of Competitive Rivalry:
- Icons for the number of competitors, industry growth rate, and differentiation.
- Bullet points listing the key factors.
Visual Elements
- Color Coding: Use different colors for each force.
- Charts and Graphs: Incorporate charts to show the number of suppliers, competitors, and growth rates.
Design for Clarity
- Layout: Arrange the sections in a circular or linear layout for easy navigation.
- White Space: Use white space to separate sections and improve readability.
- Fonts: Use clear and readable fonts, with larger fonts for headings and smaller fonts for details.
Review and Finalize
- Feedback: Share the infographic with stakeholders for feedback.
- Final Touches: Make any necessary adjustments and finalize the design.
By following this approach, you can effectively brainstorm the factors influencing the Five Forces Analysis using a mind map and then visualize the information as an engaging and informative infographic. This method enhances understanding, facilitates communication, and supports strategic decision-making.
Conclusion
Five Forces Analysis is a powerful tool for understanding the competitive dynamics of an industry. By systematically evaluating the threat of new entrants, the bargaining power of suppliers, the bargaining power of buyers, the threat of substitutes, and the intensity of competitive rivalry, businesses can develop effective strategies to navigate their competitive landscape. The case study based on the image provides a practical example of how to apply this framework to a real-world scenario, highlighting the importance of each force and the strategic implications for the company.
